This is some text inside of a div block.
Search across the whole Roadsides site


Glacial Hauntologies, our art-science collective, is an ongoing effort to dissolve boundaries between contemporary art practices and glacier science research. Through a shared ethos that each field actively shapes and “entangles” with the other (Barad 2006: 94), we exchange methodologies, conceptual knowledge and disciplinary practices through discussion, experimentation, tutorials, processing and making.
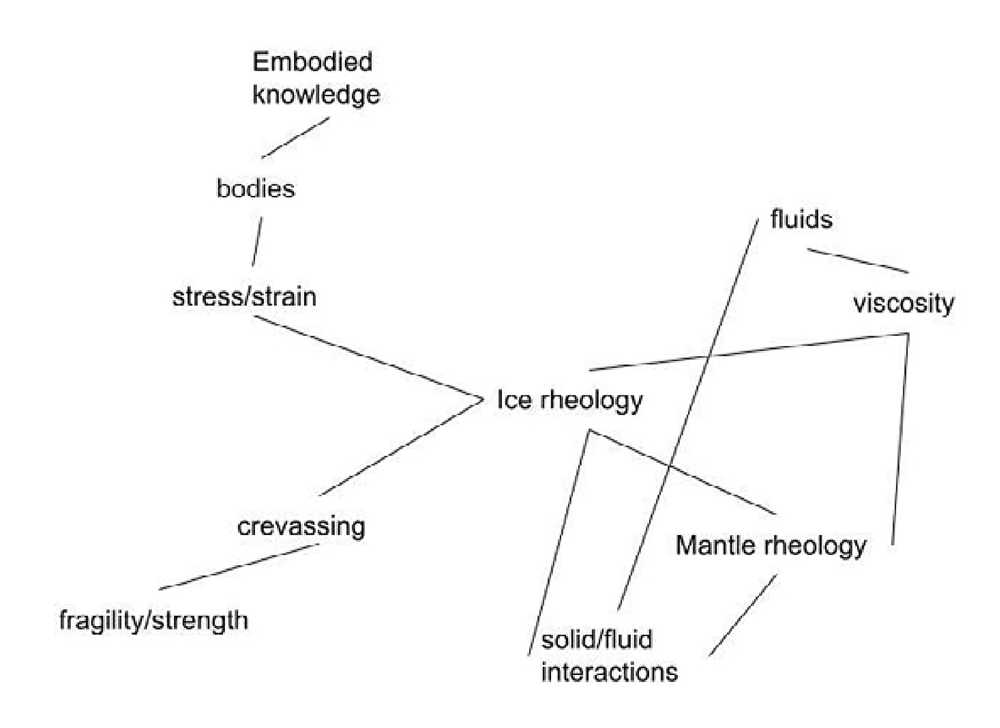
In this essay, which draws from Renee Gladman’s “prose architectures” (2017), we produce a visual entanglement of artistic and scientific concepts, processes, infrastructures and sources. The content—photographs, video stills, journal excerpts, glaciological data, sketches and fragments from performance texts—relates to the interaction of human and glacial bodies over vast temporal and spatial scales. The images begin as clearly ordered and described, sometimes extremely technically, clarifying meaning to some audiences and obscuring it to others. Then, slowly, like the rocky sediment underneath a glacier, the content is reworked: repeated, glitched and manipulated, with Case’s handwritten text from an Antarctic field season, Rai’s poetry and spoken word, logistics contracts and quotations. From and within these interactions, material is moved, shaped and mixed. An unsorted, unstratified glacial till emerges, assembling, moraine-like, into this collaboration.
Polar fieldwork requires extensive infrastructure: aeroplanes, buildings, tents, polar clothing, sleds, ships, fuel, food, helicopters, skidoos, planning documents, contracts, inventories, emails, tickets, signatures. There are also bodies—ice and human—working, observing, translating and remembering. By entangling glaciological concepts and bodily processes, archival data and performance, this essay exemplifies the overlapping, deforming, transforming infrastructures of human memory, bodily perceptions and glacial change.
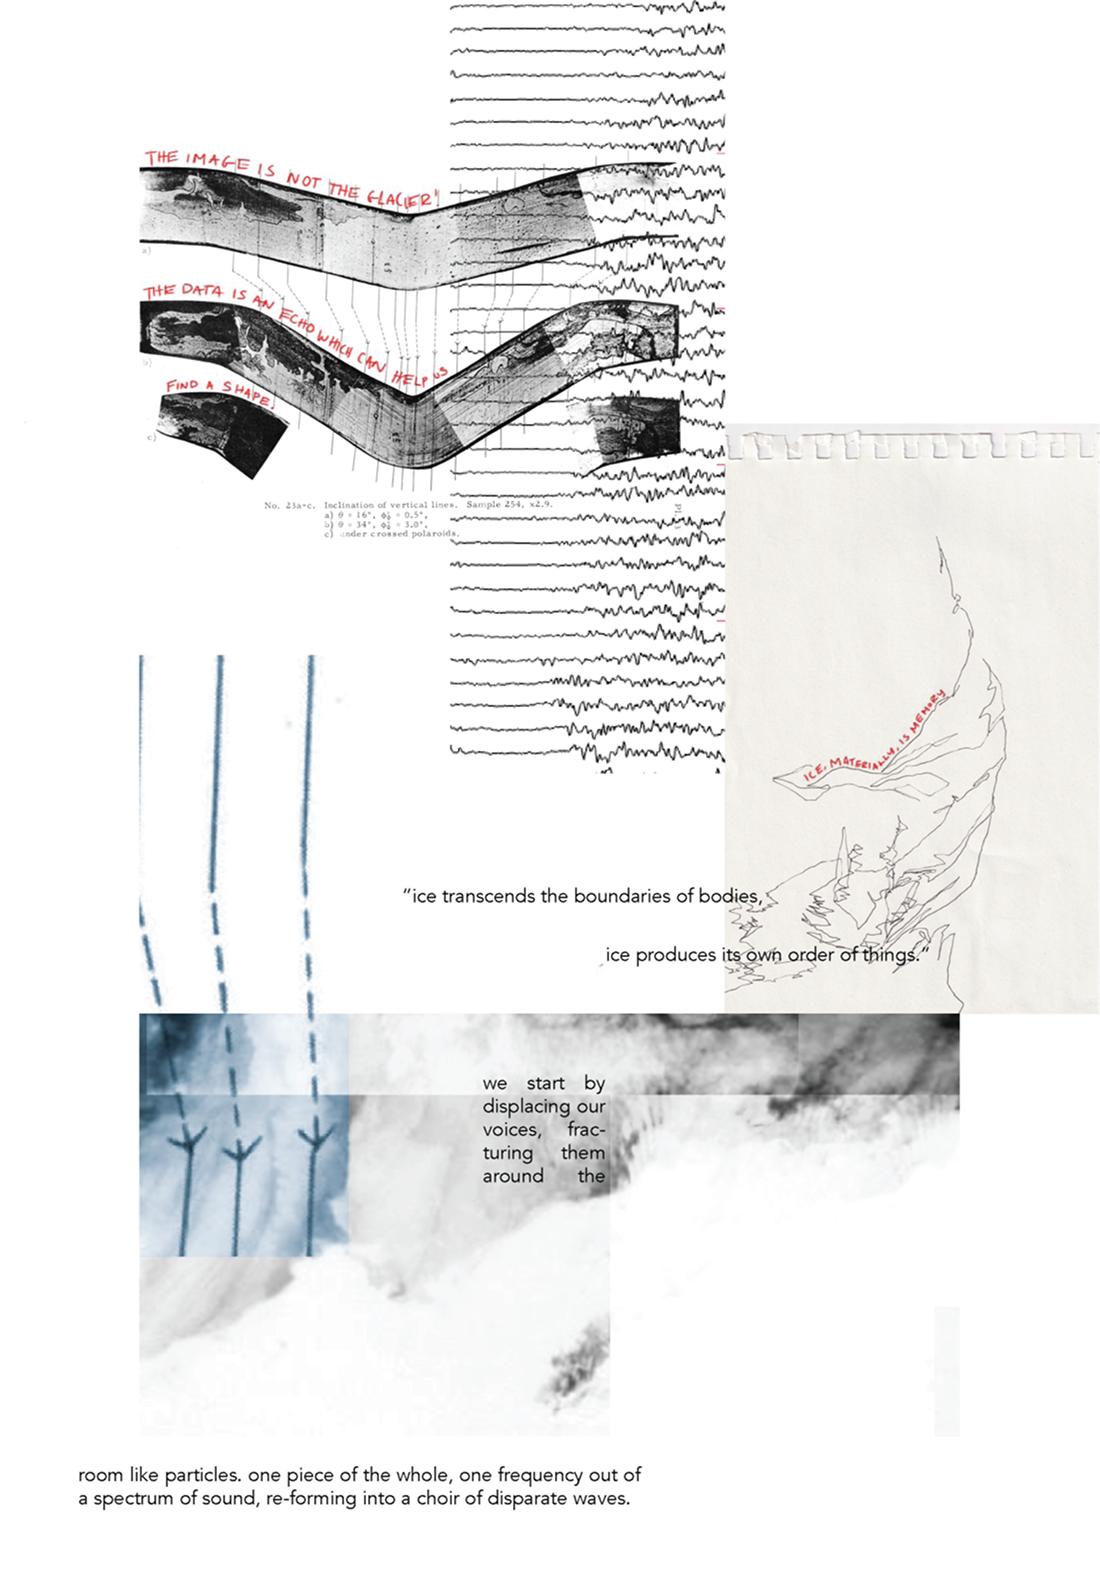
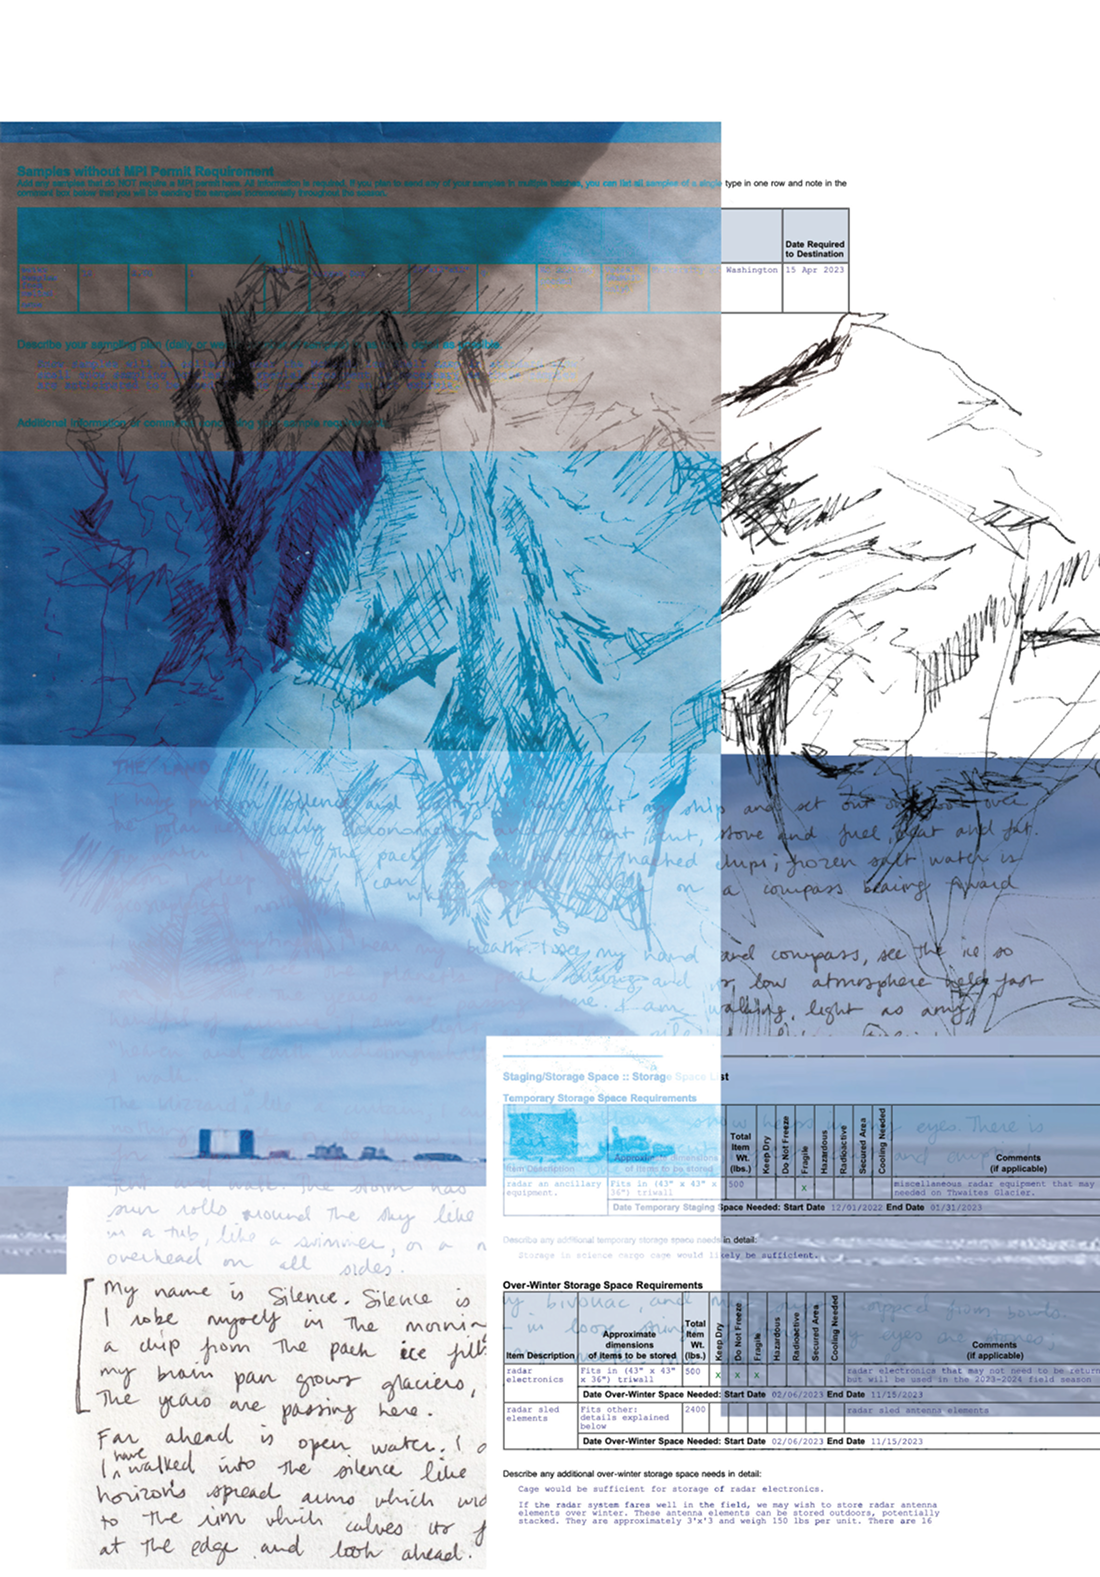
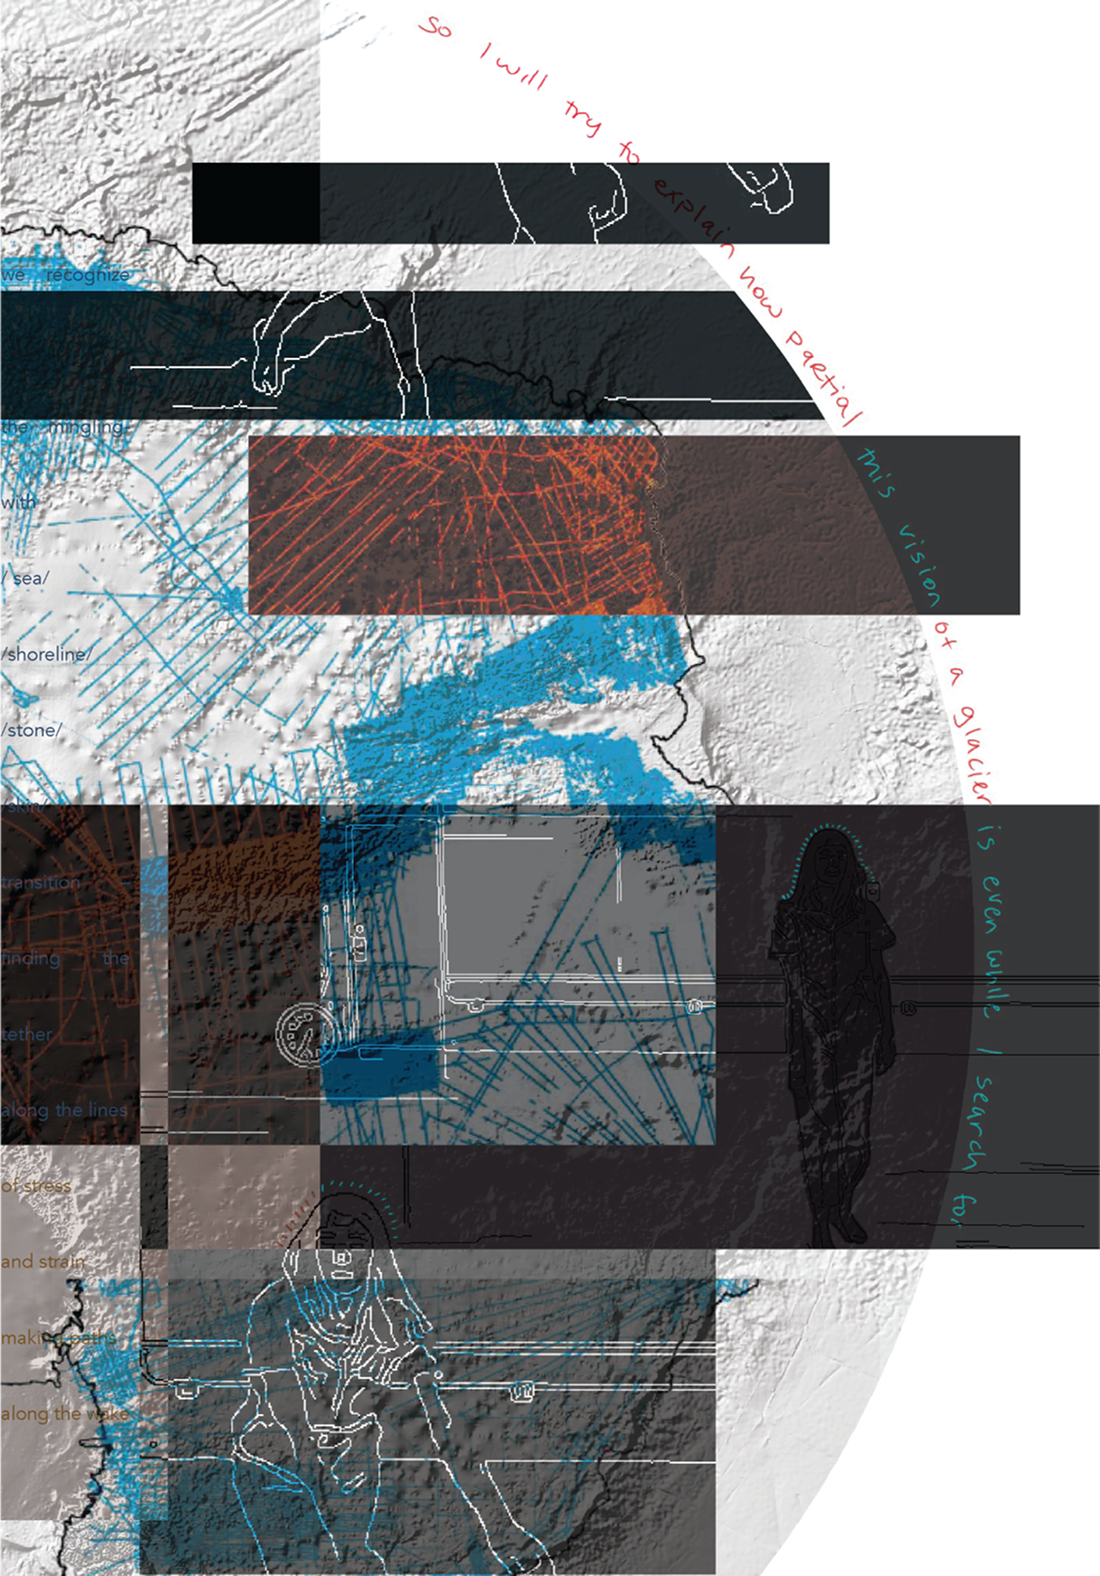
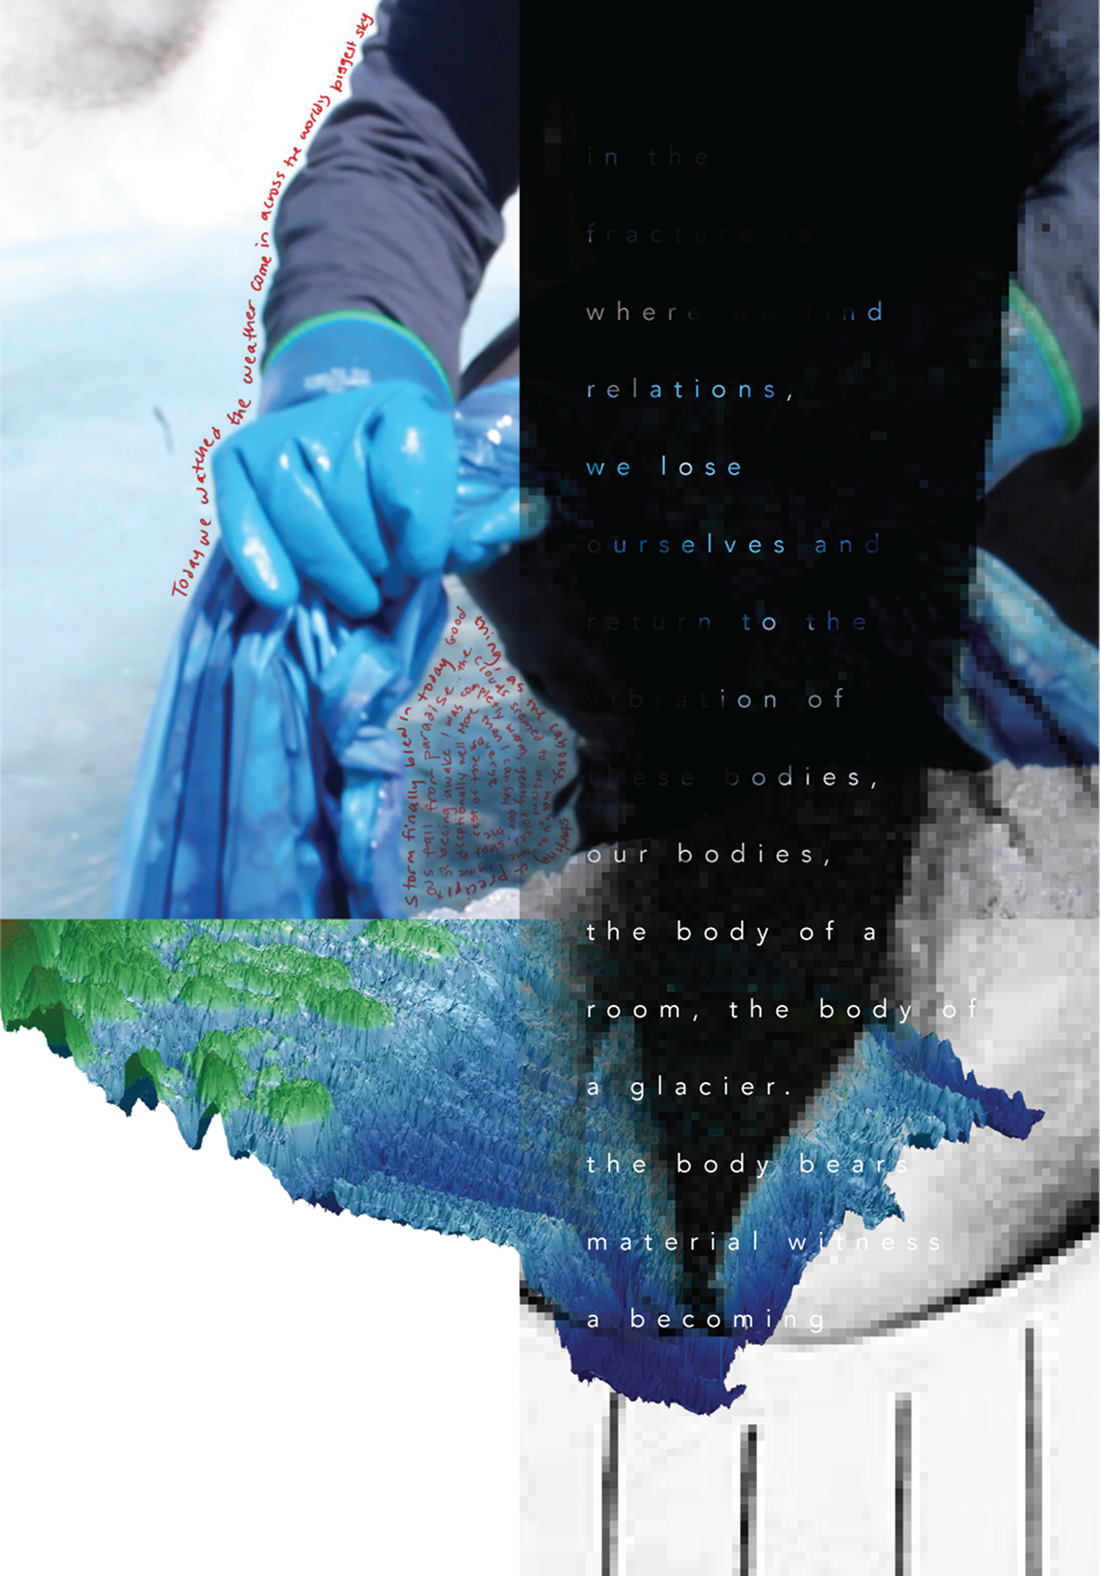
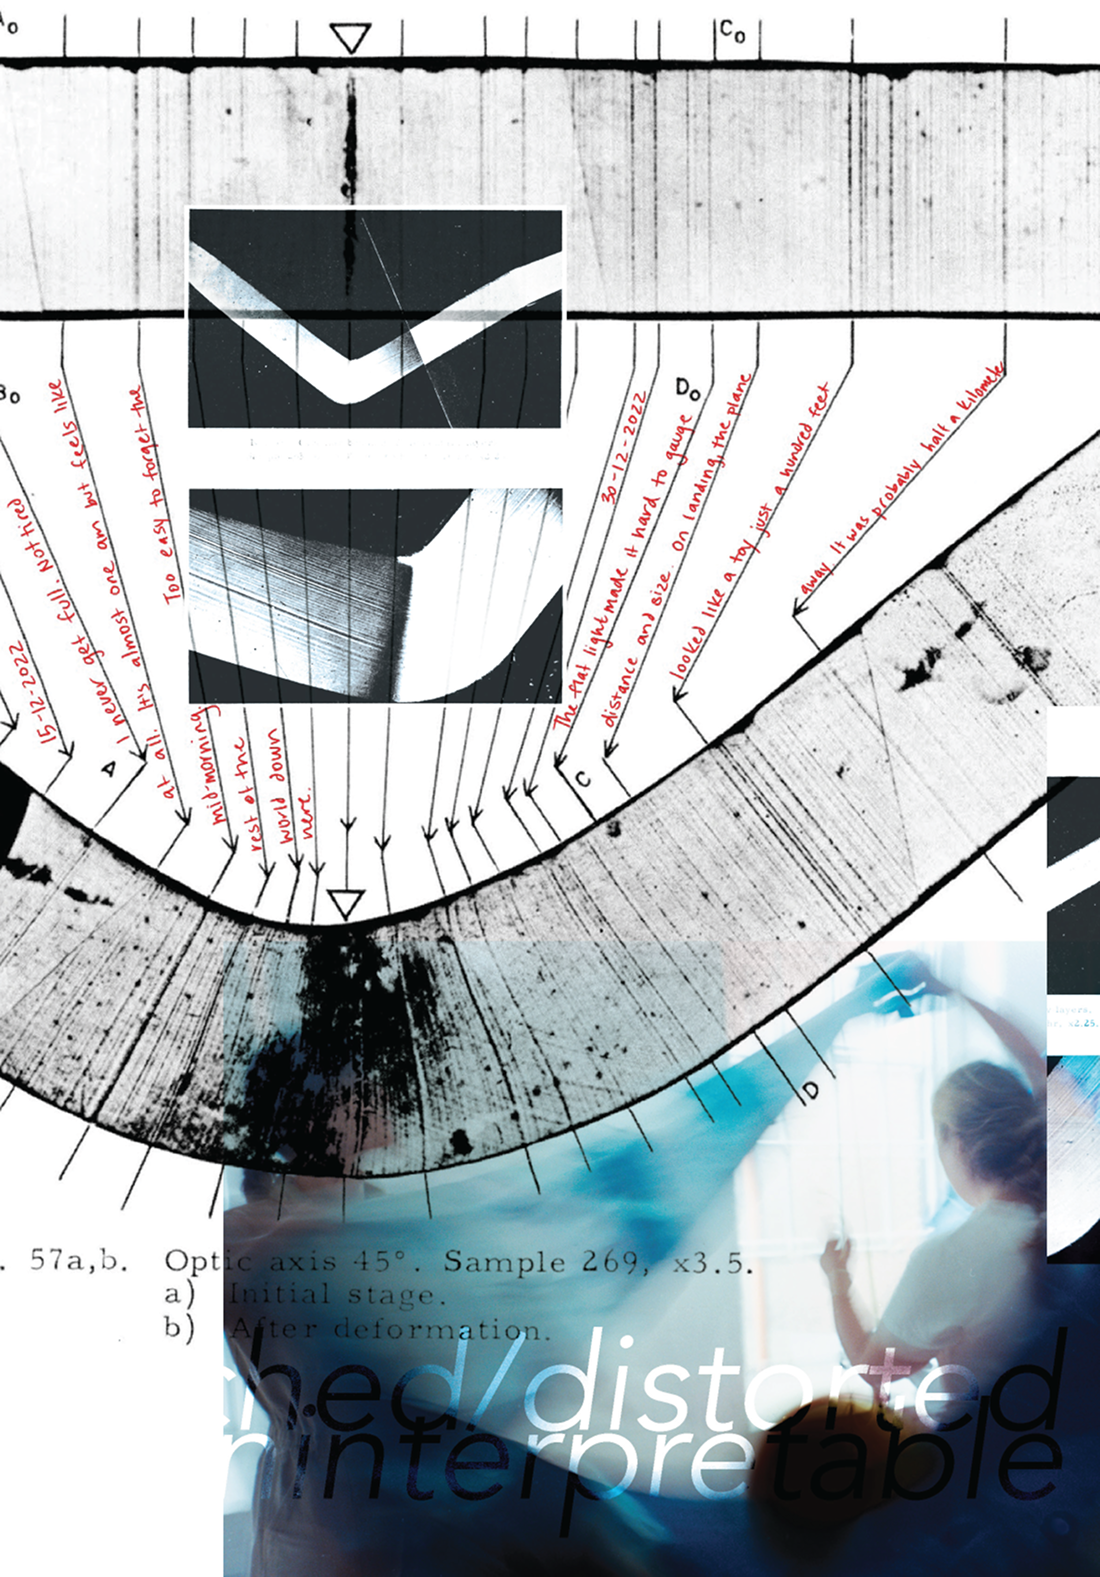
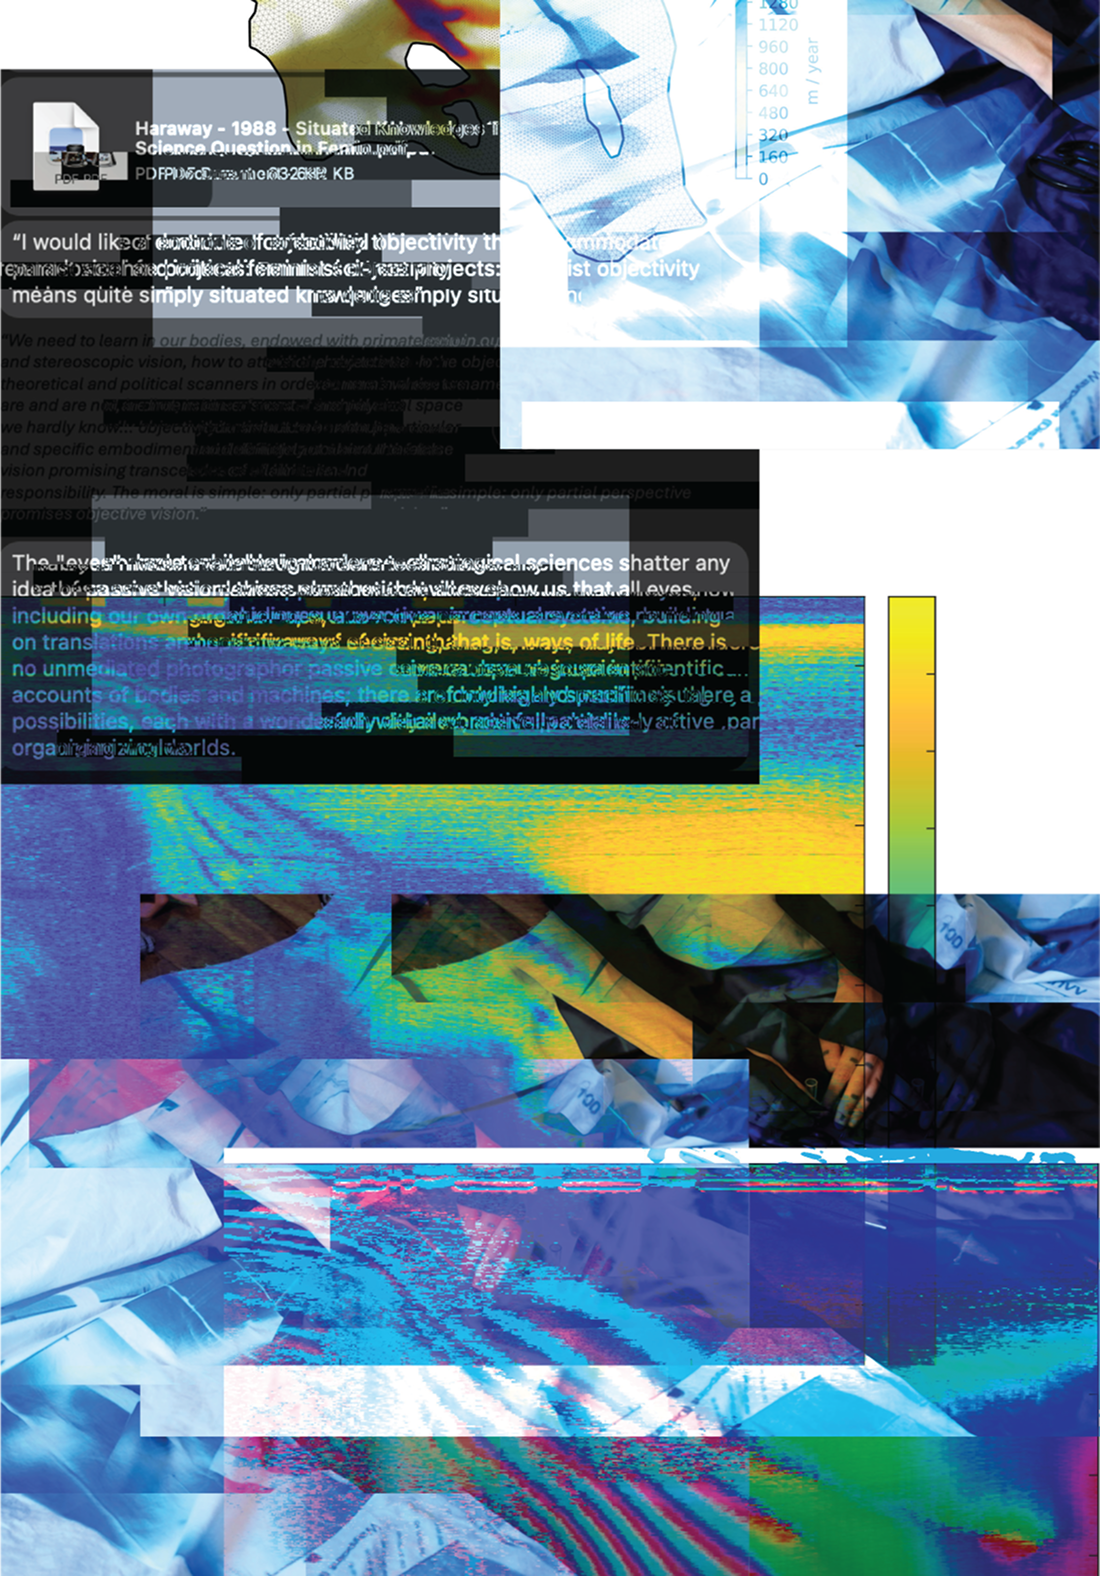
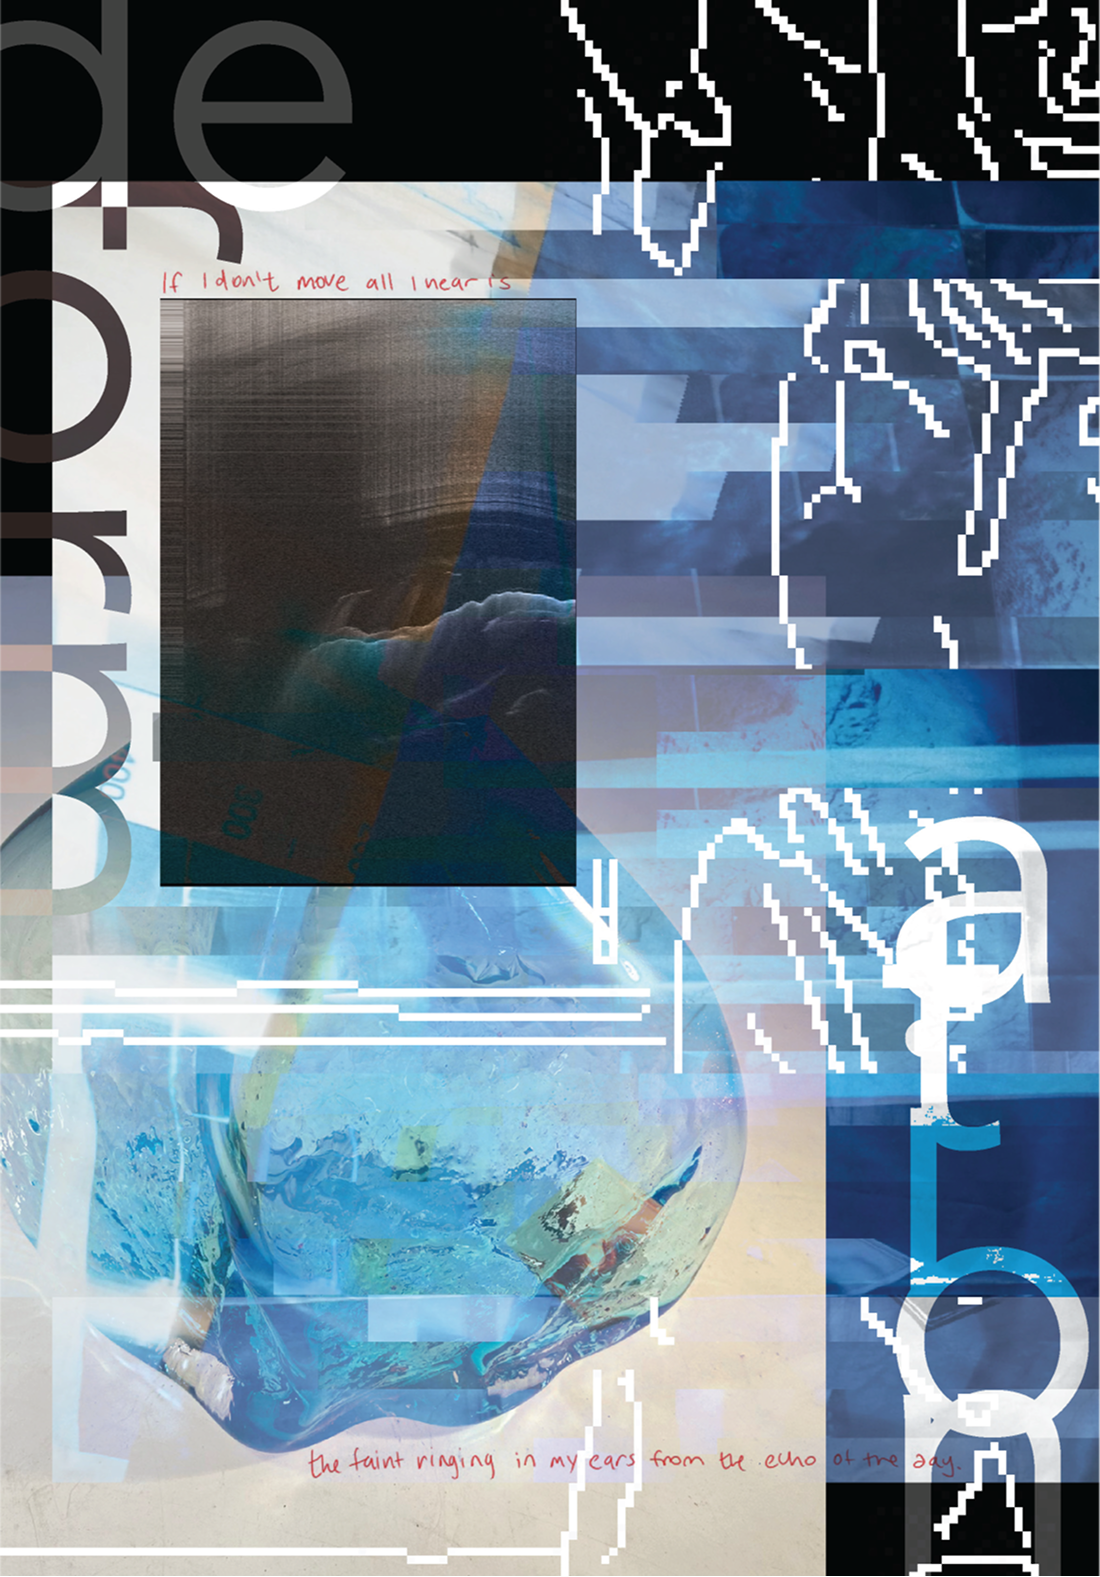
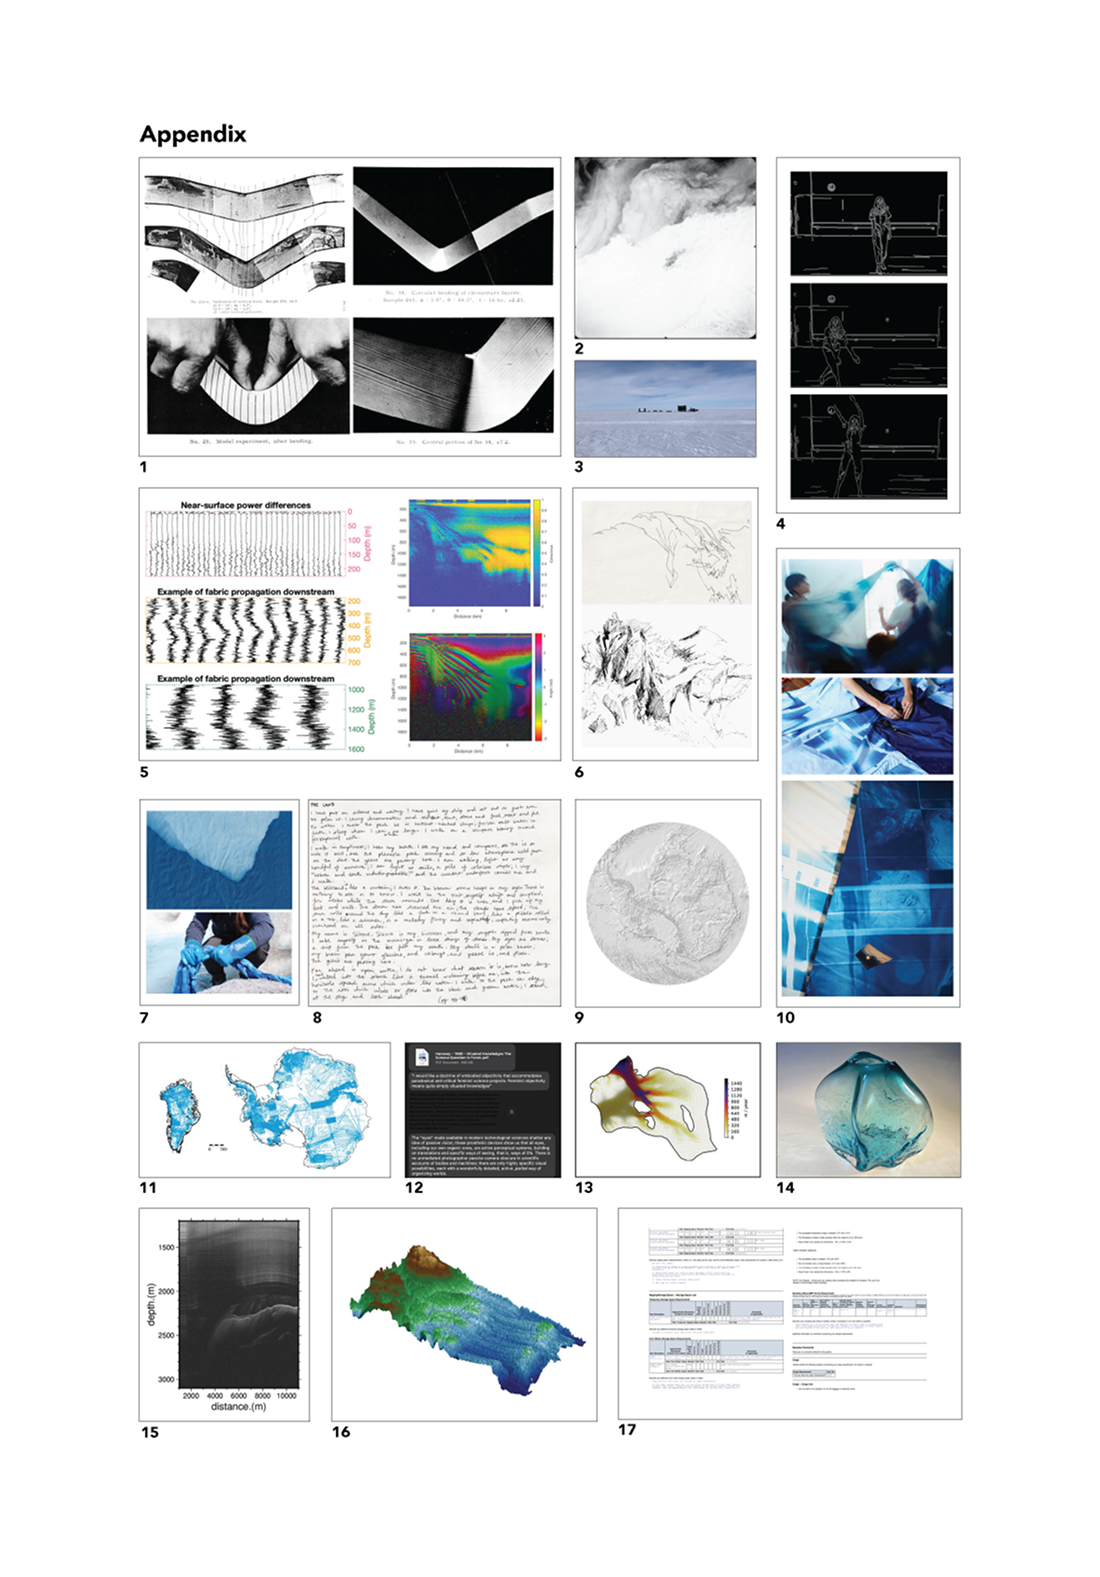
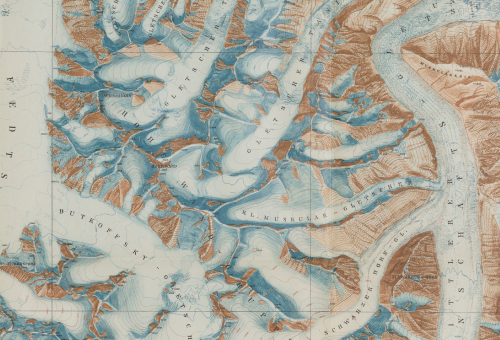
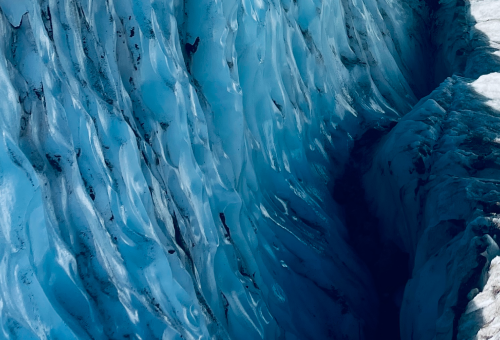
1. Ukichiro Nakaya, a twentieth-century Japanese snow scientist, ran a series of experiments in the 1950s to study how ice responds to stress, or applied force. The strength of ice and the way it responds to stress have implications for how we understand and model ice flow. These images show a sample of single, large ice crystals (up to 40 cm) from the Mendenhall Glacier, which drains from the Juneau lcefield in southeast Alaska.[1] “The deformation of single crystals of ice shows a peculiarity,” he wrote. “The specimen apparently has a structure like a stack of papers and deformation takes place by bending of this ‘paper’ and gliding between the ‘papers’” (Nakaya 1958: 2). Recently, we have begun to be able to measure the stacked, hexagonal crystal structure of ice at larger scales, outside of laboratory measurements of ice cores. In 2022–2023, Case and Hoffman traveled to Thwaites Glacier in Antarctica as members of G.H.O.S.T. (Geophysical Habitat of Subglacial Thwaites) and a part of the International Thwaites Glacier Collaboration. There, they took radar data that recorded the glacier’s ice fabric, the orientation of ice crystals that is part of a glacier’s response to stress that is applied over long timeframes and across large spatial scales. 2. A declassified aerial photograph of Thwaites Glacier in Antarctica circa 1963, taken as part of Operation Deep Freeze by the U.S. military, which remains the largest deployment of science personnel to the continent. Scientific research in Antarctica is inextricable from geopolitical contexts and military influence and relationships. The military provides much of the infrastructure for the U.S. Antarctic program. 3. Operated by the British Antarctic Survey, the Caboose is a converted shipping container that Case lived out of while doing fieldwork on Thwaites Glacier. It is pulled on skis by a PistenBully, attached between the vehicle and sleds holding fuel and equipment. 4. A manipulated video still of Rai dancing. Rai reviewed coherence plots from the radar data of ice fabric collected and processed by Case (2024) and improvised short, looping choreographies in response. Stills from the video that Rai took of the choreographies were run through an edge-detection algorithm and are part of an ongoing piece centered on the concept of coherence, which can be variously defined as a mathematical measurement of signal similarity, the emergence of sense and/or consistency (e.g., thoughts ‘cohering’), and/or different parts fitting together to form a whole, a ‘coming together’. 5. These show observations of ice fabric on Thwaites Glacier, taken with two different ground-based radar systems by Case and Hoffman. In both figures, the difference between two orthogonally polarized, co-located measurements helps us understand the strength of the ice fabric, which affects its viscosity—that is, its internal resistance, the sluggishness of the ice as fluid. Ice with a higher viscosity flows more slowly than ice with a lower viscosity, and is a key property for understanding how quickly Thwaites Glacier may retreat in the future. 6. Field sketches from the Juneau lcefield by Mode. 7. The top image shows Mode rinsing a cyanotype fabric print in a stream on the Root Glacier near McCarthy, Alaska, made during a collaborative artist residency that explored embodied research. It is part of an ongoing series of large-scale photographic ‘blueprints’, of glacial features made in the field to memorialize human connections to ice. The bottom image shows a cyanotype print on paper, made with a glacial erratic—a rock that has been moved by a glacier from its geologic origin to a new location. 8. Excerpt from An Expedition to the Pole by Annie Dillard (1992), handwritten by Mode. 9. A grayscale map showing the bed topography beneath Antarctica. 10. SIGNAL is a sculpture consisting of a collaged cyanotype sail, glass vessels and suspended ice cores. The sail, a 40-foot collage of cyanotyped fabric, is rigged with a series of pulleys and knots. The tension of the sail’s suspension alters as the ice melts, creating real-time shifts in the sculpture. The cyanotype textile collage draws on the communicative logics of flags and the mnemonic intimacy of quilts, echoing how ice fabric records a glacier’s deformation history and shapes its future flow. Top: Installation in Mode’s studio by Makenna Finch. Middle: Rai adding grommets to the sail. Bottom: fabric details, including a plot from Case’s ice-fabric measurements. 11. Available flight data for Greenland and Antarctica, which comprise the Bedmap2 datasets: an archival dataset of the ground underneath Earth’s largest ice sheets, an interpolated interpretation of the airborne radar data (Fretwell et al. 2013). 12. A text exchange between Mode and Case. 13. A finite-modeling domain for glaciers that flow into the Dotson and Crosson Ice Shelves, showing the surface speeds that are part of a global glacier mesh, where a mesh is the number and geometry of elements in finite element analysis. By iteratively solving for the stresses in the ice and conveying mass through the domain, we model how glaciers and ice sheets respond to climate. 14. Glass vessel for ice melt, designed by Rai. Hand-blown between an ice block and granite boulder. 15. Radargram—showing the return energy as a function of depth within the ice along a profile collected by towing the radar behind a snowmobile—capturing a basal unit from northeastern Greenland near the EastGRIP ice core camp. These basal units, pervasive in northeastern Greenland, are linked to fabric changes with climactic transitions and ice (NEEM community members 2013; Franke et al. 2021). 16. Map of ice sheet beds in three dimensions using multi-element radar technology. This map was generated from data collected on Thwaites Glacier in 2009, revealing subglacial landforms common in deglaciated environments. 17. As part of all fieldwork supported by the U.S. Antarctic Program, scientists fill out a Supporting Information Packet (SIP), which defines the scope of the project. This SIP described the work of the 11-165 EAGER project on the McMurdo Ice Shelf.
Coherence: Coherence has a multitude of definitions, ranging from mathematics to philosophy to everyday parlance. Mathematically, coherence defines the relationship between two orthogonal, co-located radar signals and is one measure we use when processing and analysing the ice fabric data from Thwaites Glacier. To calculate the coherence, we compute the cross-correlation and autocorrelation between the two radar measurements to understand the similarity of those measurements, given a lag or offset in time or space.
Cyanotype: Originally used by the nineteenth-century botanist Anna Atkins to document plants and algae, cyanotype printmaking involves applying UV-sensitive chemicals to fabric or paper. When exposed to sunlight, these chemicals turn the material a vibrant blue. Atkins’ botanical cyanotypes signify historic artistic approaches to researching and communicating scientific phenomena.
Hauntology: Hauntology is a word adapted from the social sciences. It was popularized by Jacques Derrida (1994). It is a compound word—haunt + ontology. Ontology is a branch of philosophy focused on the nature of being and how entities relate to one another. Hauntology describes how the present is affected by the culture, concepts and context of the past, as well as the weight of failed futures. These past and future ‘ghosts’ reach through time, changing meanings and relationships in the present.
Ice Fabric: Glacial ice has a hexagonal crystal structure. The orientation of the ice crystals affects the physical and electromagnetic properties of ice. The bulk orientation of ice crystals in a glacier is called the ice fabric.
Till: Unsorted glacial sediment.
Barad, Karen. 2006. Meeting the Universe Halfway: Quantum Physics and the Entanglement of Matter and Meaning. Duke University Press.
Case, Elizabeth. 2024. “Ice Formation, Deformation, and Disappearance”, PhD dissertation. Columbia University.
Derrida, Jacques. 1994. Specters of Marx: the State of the Debt, the Work of Mourning, and the New International. Routledge.
Franke, Steven, Daniela Jansen, Sebastian Beyer, Niklas Neckel, Tobias Binder, John Paden and Olaf Eisen. 2021. “Complex basal conditions and their influence on ice flow at the onset of the Northeast Greenland Ice Stream.” Journal of Geophysical Research: Earth Surface 126: e2020JF005689. https://doi.org/10.1029/2020JF005689
Fretwell, P., H. D. Pritchard, D. G. Vaughan, J. L. Bamber, N. E. Barrand, R. Bell, C. Bianchi, R. G. Bingham, D. D. Blankenship, G. Casassa, G. Catania, D. Callens, H. Conway, A. J. Cook, H. F. J. Corr, D. Damaske, V. Damm, F. Ferraccioli, R. Forsberg, S. Fujita, Y. Gim, P. Gogineni, J. A. Griggs, R. C. A. Hindmarsh, P. Holmlund, J. W. Holt, R. W. Jacobel, A. Jenkins, W. Jokat, T. Jordan, E. C. King, J. Kohler, W. Krabill, M. Riger-Kusk, K. A. Langley, G. Leitchenkov, C. Leuschen, B. P. Luyendyk, K. Matsuoka, J. Mouginot, F. O. Nitsche, Y. Nogi, O. A. Nost, S. V. Popov, E. Rignot, D. M. Rippin, A. Rivera, J. Roberts, N. Ross, M. J. Siegert, A. M. Smith, D. Steinhage, M. Studinger, B. Sun, B. K.Tinto, B. C. Welch, D. Wilson, D. A. Young, C. Xiangbin, and A. Zirizzotti. 2013. “Bedmap2: improved ice bed, surface and thickness datasets for Antarctica.” The Cryosphere 7: 375–93. https://doi.org/10.5194/tc-7-375-2013
Gladman, Renee. 2017. Prose Architectures. Wave Books.
Nakaya, Ukichiro. 1958. “Mechanical Properties of Single Crystals of Ice: Part 1: Geometry of Deformation.” U.S. Army Snow Ice and Permafrost Research Report 28.
NEEM community members. 2013. “Eemian interglacial reconstructed from a Greenland folded ice core.” Nature 493: 489–94.
